Overview:
The Bike Sales Report (Q&A) feature in PowerBI allows users to ask questions about the sales data and receive both numerical and graphical responses. This tool enhances data exploration by providing immediate answers and visual representations based on user queries.
Screenshots

Key Features:
1. Natural Language Interaction:
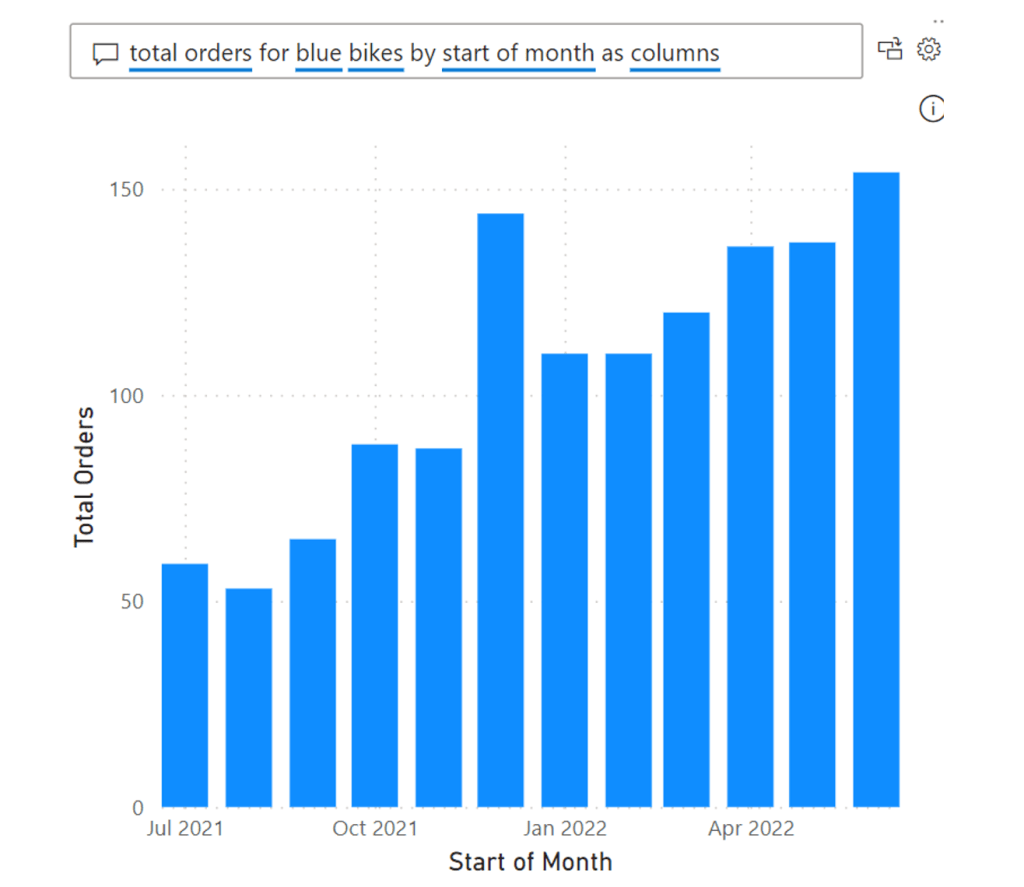
The Q&A feature allows users to input questions using prompt, making it easy to explore the sales data without technical knowledge of querying.
2. Numerical and Visual Responses:
The system not only returns numerical values but also generates visual representations, such as bar charts, line graphs, or pie charts, to help users better understand the data trends and insights.
3. Interactive Data Exploration:
Users can ask follow-up questions and refine their queries, gaining deeper insights into specific sales metrics through interactive exploration.
Category:
Tags:
Links:

Leave a comment