Overview:
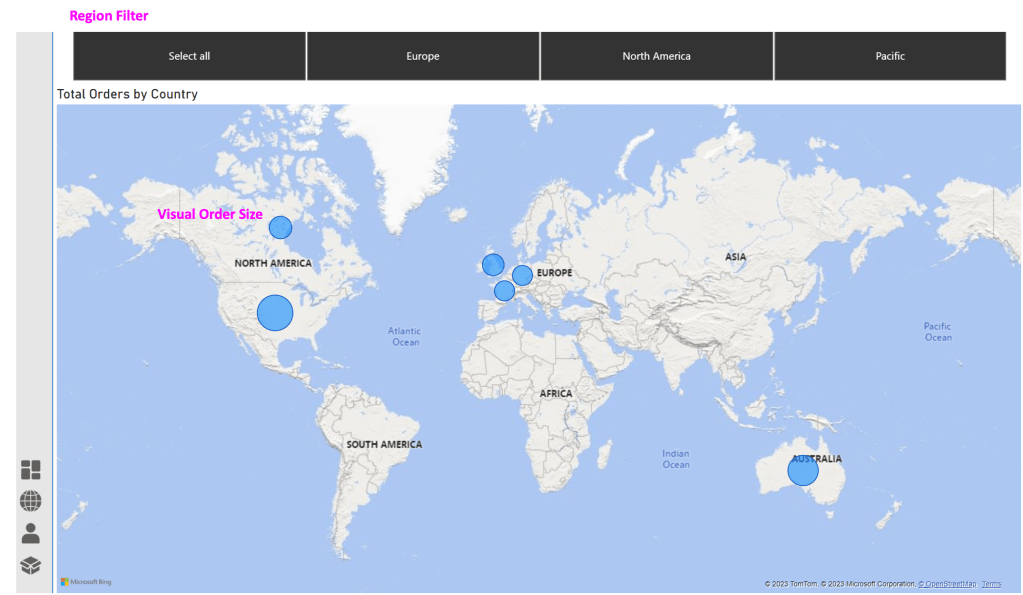
The Bike Sales Report (Map) in PowerBI provides a geographic representation of bicycle sales data. The map uses bubble sizes to indicate the volume of orders, making it easy for users to visually assess the contribution of each country to overall sales.
Screenshots

Key Features:
1. Bubble Size Representation:
The map visually represents order volume by country, with larger bubbles indicating higher sales, allowing users to quickly identify key markets and sales hotspots.
2. Geographic Sales Analysis:
By plotting sales data on a map, users can easily analyze the distribution of sales across different regions, making it easy to assess performance on a global scale.
3. Interactive Data:
The map is interactive, allowing users to hover over specific countries to see detailed sales figures and trends for each region, offering a dynamic exploration of geographic data.
Category:
Tags:
Links:

Leave a comment