Overview:
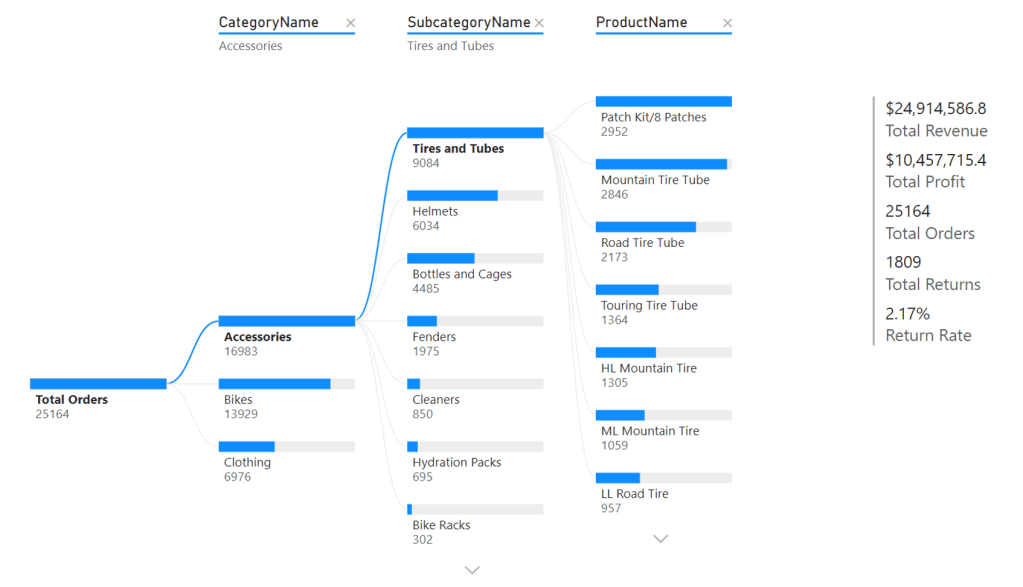
The Bike Sales Report (Decomposition Tree) in PowerBI visually breaks down the contributions of various factors to overall bicycle sales. This tree structure helps users analyze how different elements like product categories, customer segments, and regions impact sales figures.
Screenshots

Key Features:
1. Contribution Breakdown:
The Decomposition Tree visually breaks down the contribution of different factors such as product categories, regions, and customer segments to overall bicycle sales, making it easy to understand their impact.
2. Drill-Down Analysis:
Users can interact with the tree to drill down into specific elements, exploring the hierarchy of sales contributors, from broader categories down to more granular details.
3. Clear Visualization:
The tree structure provides an intuitive way to identify key performance drivers, highlighting areas of strength and opportunities for improvement in the sales process.
Category:
Tags:
Links:

Leave a comment